
Page 88 - ElectriCar Magazine
P. 88
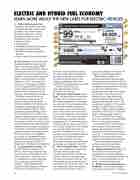
ELECTRIC AND HYBRID FUEL ECONOMY
LEARN MORE ABOUT THE NEW LABEL FOR ELECTRIC VEHICLES
 1. Vehicle Technology & Fuel: The upper right corner of the label will display text and a related icon to identify it as a vehicle that is powered by electricity. You will see different text and icons on
the labels for other vehicles:
• Gasoline Vehicle
• Diesel Vehicle
• Compressed Natural Gas Vehicle • Hydrogen Fuel Cell Vehicle
• Flexible-Fuel Vehicle: Gasoline-
Ethanol
• Plug-In Hybrid Electricity-Gasoline
2. Fuel Economy: For most vehicles the label shows City, Highway, and Combined miles per gallon (MPG) values. The Combined MPG value is the most prominent for the purpose of quick and easy comparison across vehicles. Some form of the miles per gallon metric has been on vehicle labels since 1977. Combined fuel economy is a weighted average of City and Highway MPG values that
is calculated by weighting the City value by fifty-five percent and the Highway value by forty-five percent.
For those vehicles that do not
use liquid fuels, such as electric vehicles, Plug-In Hybrid Electric Vehicles operating on electricity and compressed natural gas vehicles,
the labels display miles per gallon gasoline equivalent (MPGe). Think
of this as being similar to MPG, but instead of presenting miles per gallon of the vehicle’s fuel type, it represents the number of miles the vehicle can go using a quantity of fuel with the same energy content as a gallon of gasoline. This allows a reasonable comparison between vehicles using different fuels. For example, you can use MPGe
to compare a Compressed Natural Gas (CNG) vehicle with a gasoline vehicle; even though CNG is not dispensed or burned in actual gallons. 3. Comparing Fuel Economy: This text indicates the category of the vehicle and the best and worst fuel economy within that category for the given model year. There are nine
car categories, six truck categories, and a “special purpose vehicle” category. These categories are
used only for labeling and consumer information purposes and do not
86
serve any other regulatory purpose. For each model year, EPA publishes lists identifying the best and worst
fuel economy performers in each category available at http://www. fueleconomy.gov/feg/best-worst.shtml.
This text also tells you the
best combined fuel economy
among all new vehicles.
4. You Save or Spend More over 5 Years: The label shows the estimated fuel cost over a five-year period for the vehicle compared to the average new vehicle. If the vehicle would save the consumer money compared to
the average vehicle, the label would state, “You save $x,xxx in fuel costs over 5 years compared to the average new vehicle.” If the vehicle would be more expensive to operate than the average vehicle, the label would state, “You spend $x,xxx more in fuel costs over 5 years compared to the average new vehicle.”These estimates are based on 15,000 miles per year, for five years, and the projected fuel price for the year (12 cents per kilowatt- hour in this example). For more information on the source of projected fuel prices see “Details in Fine Print”. 5. Fuel Consumption Rate: Kilowatt- hours is an energy unit for electricity. This value tells you how many kilowatt-hours the vehicle would use to travel 100 miles. Like gallons per 100 miles, this kilowatt-hours per 100 miles relates directly to the amount of electricity used, and thus to cost. This is an estimated rate of consumption; any given vehicle may or may not
be actually capable of traveling 100 miles on a fully charged battery.
While an MPG estimate is a
required feature that has appeared
on the fuel economy label for several decades, this metric can be potentially misleading when consumers compare fuel economy improvements, particularly when they use it in place of fuel costs. The following chart shows the non-linear relationship between gallons used over a given distance and miles per gallon. The fuel savings, in gallons, for a vehicle that gets 10 MPG versus a vehicle
that gets 15 MPG is about 33 gallons (assuming 1000 miles). On the other hand, the fuel savings in gallons,
for the same 5 MPG fuel economy jump, for a 30 MPG versus a 35 MPG vehicle is only about 5 gallons.
This “MPG illusion” demonstrates why it may be more meaningful to express fuel efficiency in terms of consumption rather than in terms of economy. A fuel consumption metric allows for more accurate energy usage comparisons among vehicles.
The revised label includes both
fuel economy and consumption information for all vehicle types.
6. Estimated Annual Fuel Cost: The annual fuel cost is based on two assumptions: an annual mileage of 15,000 miles and a projected electricity price. For more information on the source of projected fuel prices.
7. Fuel Economy and Greenhouse GasRating: The new label assigns each vehicle a rating from 1 (worst)
ElectriCar Magazine
